Introduction
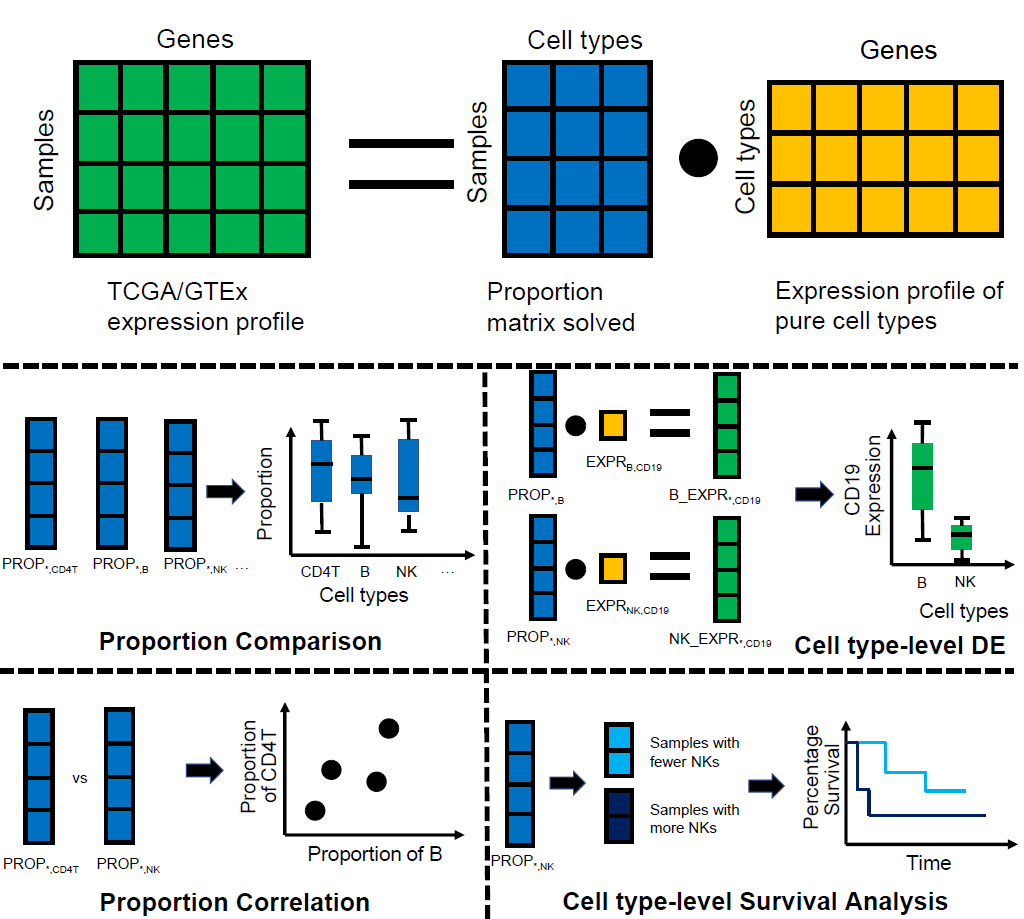
GEPIA (Gene Expression Profiling Interactive Analysis) has been a valuable and highly cited resource for gene expression analysis based on tumor and normal samples from the TCGA and the GTEx databases. We present GEPIA2021, a standalone extension with multiple deconvolution-based analysis for GEPIA. We deconvolute each sample tool in TCGA/GTEx with the bioinformatics tools CIBERSORT, EPIC and quanTIseq. Based on the inferred cell proportions in each bulk-RNA sample, we can then perform multiple downstream analysis:
Proportion Analysis: Visualize the proportion of each cell type selected with the interactive boxplot. Users can perform the quantitative comparison (ANOVA) of the proportion among cell types or TCGA/GTEx sub-datasets.
Correlation Analysis: Visualize the proportion of two cell types simultaneously. Users can perform the quantitative comparison based on the Pearson Correlation Coefficient.
Sub-expression Analysis: Visualize the gene expression in each cell type selected with the interactive boxplot, and perform the cell type-level differential expression analysis. Similar with the Proportion Analysis, the differential expression analysis with ANOVA is also available.
Survival Analysis: Separate the samples into two groups according to the proportion of selected cell types. Then plot the Kaplan–Meier curve of each group with the survival data. The statistical difference between the curves can be measured by the log-rank test.
Detailed documentations, usage examples and frequently asked questions can be seen in the Help page. If you meet any questions, please do not hesitate to contact us for further supports.
This website is free and open to all users and there is no login requirement. If you use GEPIA2021 in your work, please cite our paper.
Update Notes (2022-04-27): We apply the absolute proportions estimated by CIBERSORT with "no.sumto1" mode by default.